The big question after finishing a digitization project is how to track your Returns on Investment regarding the user acceptance. In addition to the mental and professional acceptance it’s important to get a usage overview of the digitized process. Often you will hear sentences like “Nobody will use it!”, “Are you sure that our colleagues will use it regularly?” or “Has it paid off?”. Especially for Key Users, heads of departments or other management staff it is the most important key figure to review a project and justify the financial and time efforts.
But how to prove the new ways of working and user acceptance? In addition to surveys you can use some technical solutions which deliver valid key figures. In this blog post we look into an example of Office 365, especially SharePoint Online.
Usage overview of modern SharePoint sites
After creating different Site Collections for every department with special functions and ways to work it is important to find out the usage of the different sites. Fortunately, Microsoft created a default usage report in Modern SharePoint sites to get a facile overview of all users. All accesses are anonym, but we recommend to speak with your work council and with consultancies regarding GDPR. The modern usage report is accessible via Site Contents and looks as following:
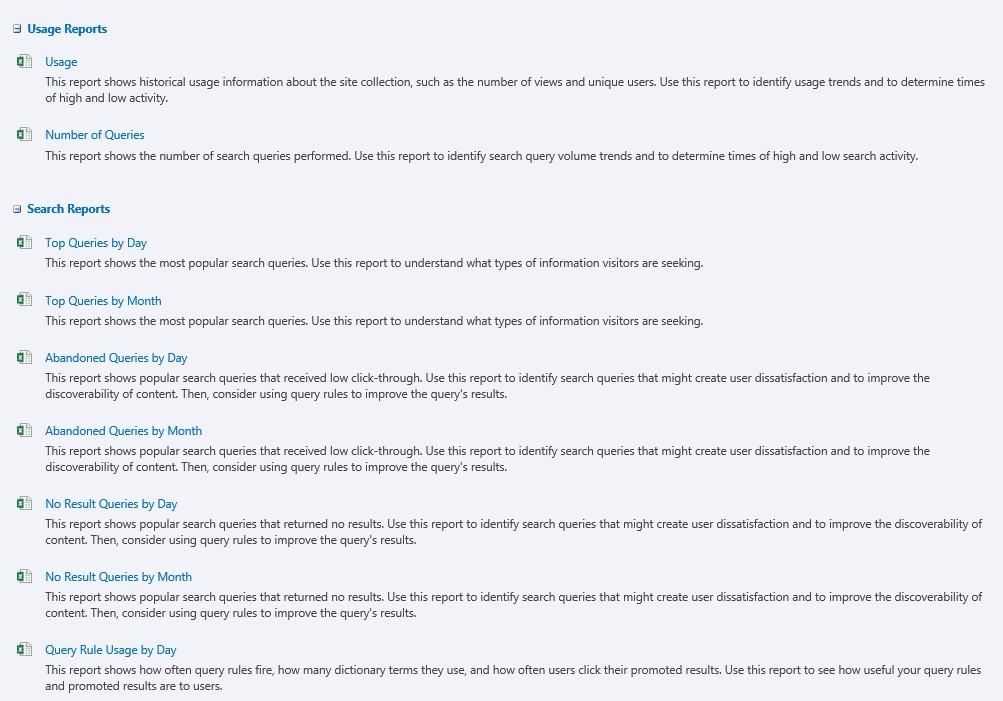
But what to do in case you are using classic Site Collections or you need a deeper insight to the usage of your new working environment. There are some default reports which are offered from Microsoft. They are accessible via Site Settings and “Popularity and Search Reports”. All the reports are opened in Excel.
Unfortunately, the reports are not meaningful regarding usage and user acceptance.
Tracking user acceptance: Google Analytics for deeper insights
If you already have been working as a web designer or in the online marketing you will already know the #1 tracking tool on the market. But I guess most of you haven´t used it for internal analyzes: Google Analytics.
You don’t have to be a fan of one of the biggest technology companies, but Google Analytics offers some great possibilities to get a deeper insights of your digitization projects. You can have an overview of site accesses which are very detailed and anonym. This shouldn’t be an advertisement for Google but in case you are reporting your homepage using Analytics why don’t you use it for SharePoint sites regarding numbers of users, sessions, bounce rates etc.?
You find the technical implementation in the great tutorial How to add Google Analytics to SharePoint (second paragraph) – “Install Google Analytics on SharePoint”. Big praise to the author Joao Ferreira on his blog Hands on SharePoint. All we need is a Google Analytics account! Well, OK you also need some time and traffic on your website ???? At least after one month of using Google Analytics the fun begins. Afterwards it´s possible to get an overview of different numbers like:
- How many users started at least one session? (users)
- How many users are visiting this site for the first time? (new users)
- How many sessions were started?
- How many sessions were started in average per user?
- How many sites were visited in average per session?
- How long took a session in average?
- What is the bounce rate comparing the number of sessions?
- Which sites were accessed very often and how long was the stay at the page?
- How many users are at the site at this moment?
- Where are the users located (geographically)?
Unfortunately, we found out that it’s not possible to combine different Site Collections with each other. Therefor you can manually transfer your important numbers to Excel or to SharePoint lists. Another great option is Power BI but it’s not as easy as it sounds. Using Power BI requires some additional skills.
Thanks to these key figures we have the chance to get a usage review which is also important for the future of your digitization agenda.
Looking at the number of employees in context of sessions and accesses is important.In some departments where you find some low-key figures after finishing the project (incl. user trainings and rollout) you get the chance to react on numbers of sessions, users and bouncing rates. All these key figures can be discussed with the Key Users in a department meeting. In the meeting you will find out whether technical or professional issues are the reason for low numbers.
Another big improvement potential is retrievable in the report used devices and browsers. On one hand errors occur because of using browsers like Google Chrome, Microsoft Edge or Mozilla Firefox. On the other hand, the report shows whether mobile devices are used. This can be forced to give the users an easier access to their new working place. This can also be one reason to increase the user acceptance.
So, in case you get faced with sentences like “Nobody takes advantages of it!” you have the chance to show some fact-based reports. Especially in case of potentially low encouragement and will be able to track, where people stop using it etc. to then improve the user´s journey
Which methods regarding Change Management can be used increasing the acceptance is findable in our blog post HOW WE KEEP A CHANGE PROCESS RUNNING – A USE CASE FOR CIP or we show you different ways in a personal interview.